Build a control chart for subgroup standard deviations using either the
normalized limits supplied by qcc::qcc() or exact probability limits
derived from the chi-square distribution of the sample variance.
Usage
cchart.S(x, type = c("n", "e"), m = NULL)Arguments
- x
Subgroup data accepted by
qcc::qcc()for an"S"chart. Rows represent subgroups and columns observations within subgroups.- type
Either
"n"for the normalized qcc limits or"e"for exact equal-tail probability limits.- m
Integer subgroup size, at least 2. It is required when
type = "e". If omitted, a warning is issued and the normalized chart is drawn instead.
Value
Invisibly, the "qcc" object returned by qcc::qcc().
The function also draws the chart.
Details
Under multivariate normal sampling reduced to a univariate subgroup,
\((m-1)S^2/\sigma^2\) follows a chi-square distribution with
\(m-1\) degrees of freedom. The exact limits are therefore
$$\hat\sigma\sqrt{\chi^2_{0.00135,m-1}/(m-1)}$$
and
$$\hat\sigma\sqrt{\chi^2_{0.99865,m-1}/(m-1)},$$
where \(\hat\sigma\) is obtained with qcc::sd.S(x).
Errors and warnings
An error is raised for an unsupported type or an invalid supplied
m. If exact limits are requested without m, the function
warns and falls back to the normalized chart. Additional data validation is
performed by qcc::qcc() and qcc::sd.S().
Examples
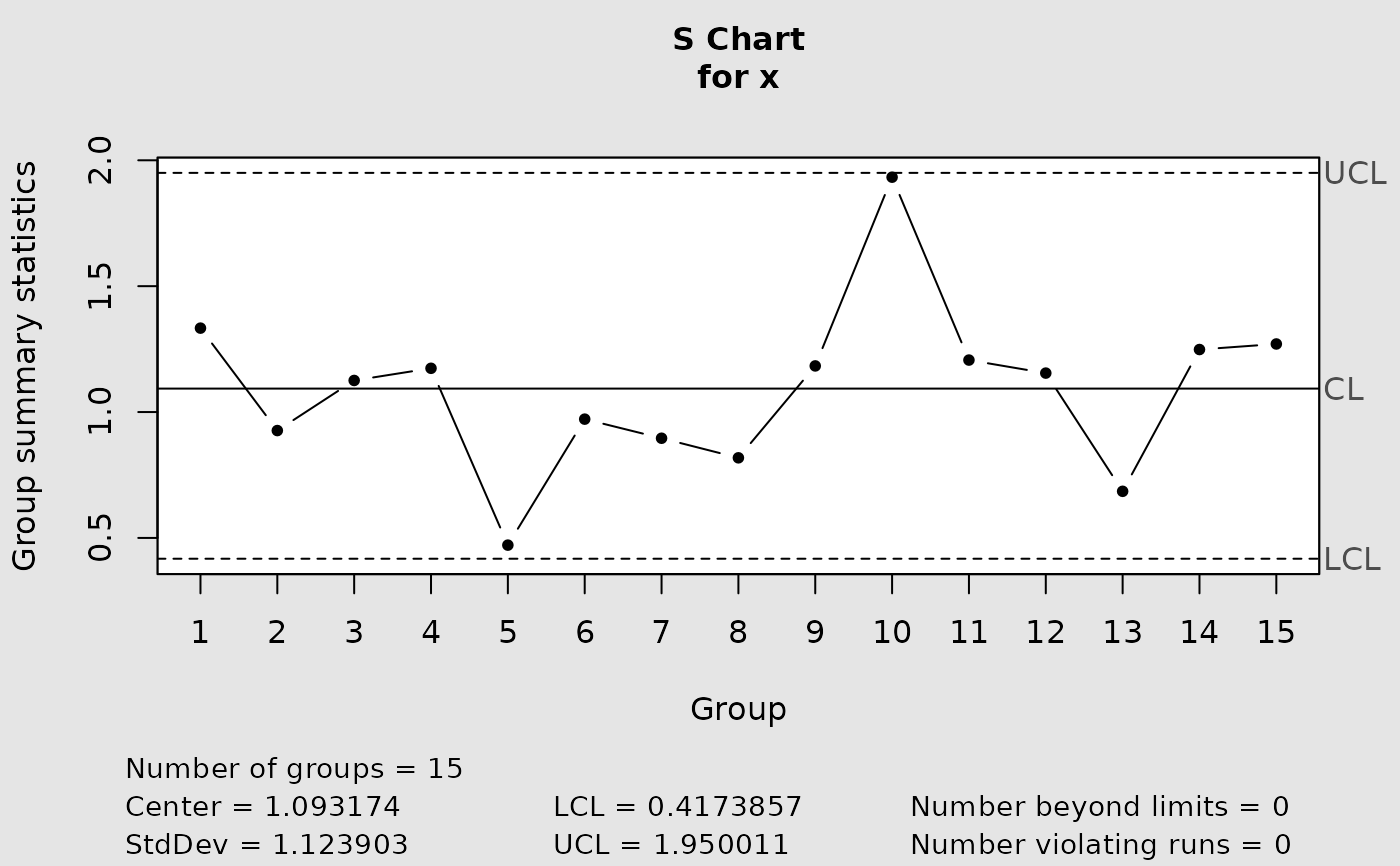
data(softdrink)
normalized <- cchart.S(softdrink, type = "n")
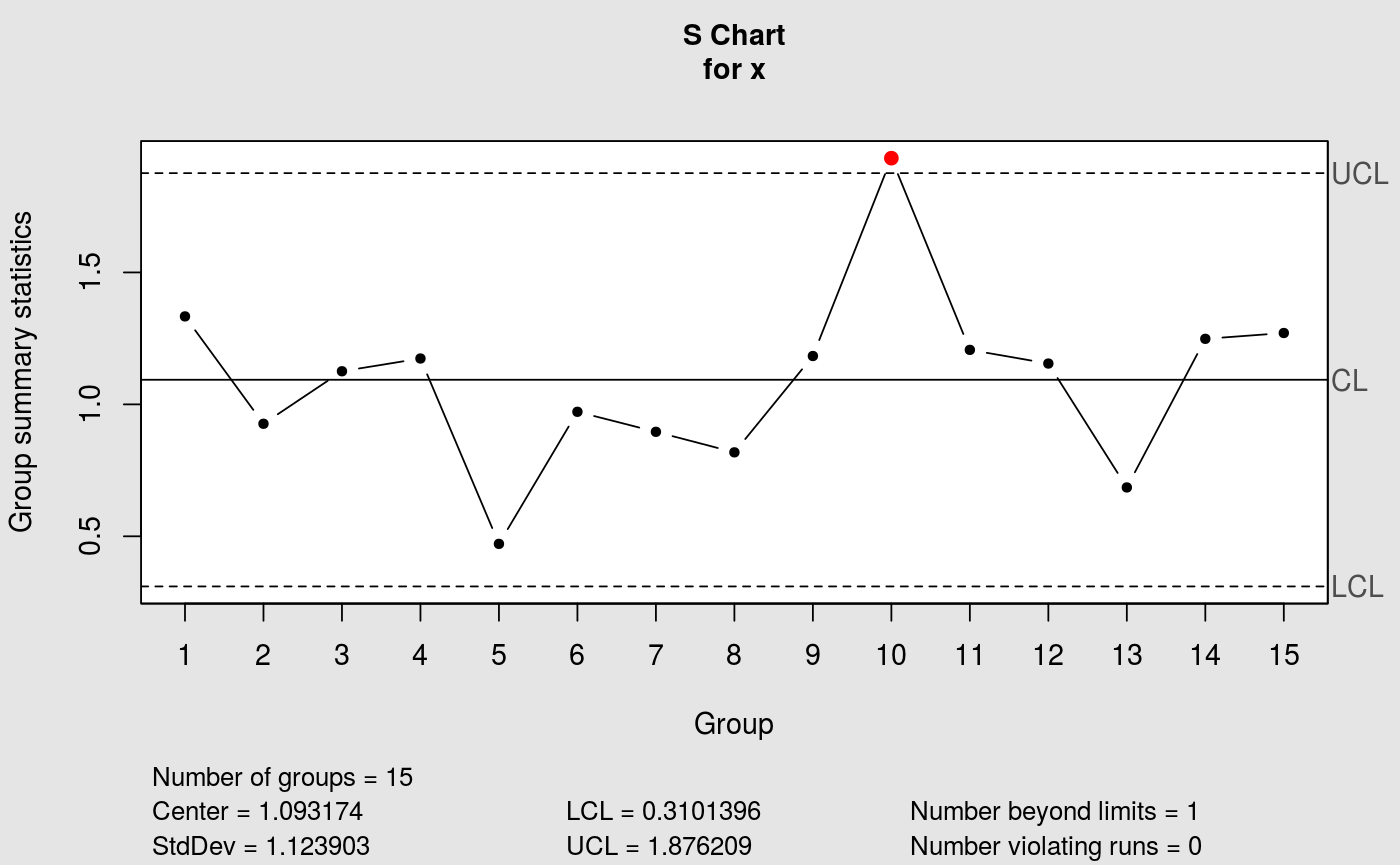 exact <- cchart.S(softdrink, type = "e", m = 10)