Build normal, Cornish-Fisher corrected, or standardized u charts.
Usage
cchart.u(
  x1 = NULL,
  n1 = NULL,
  type = "norm",
  u1 = NULL,
  x2 = NULL,
  n2 = NULL,
  lambda = NULL,
  u2 = NULL,
  alpha = ALPHA
)
Arguments
- x1
Phase I defect counts.
- n1
Phase I inspection size or vector of sizes.
- type
Chart type:
"normal","cf1","cf2", or"standardized". Legacy aliases"norm","CF", and"std"remain supported;"CF"maps to"cf2"because the historical IQCC formula contains both Cornish-Fisher adjustments.- u1
Phase I rates, used instead of
x1.- x2
Phase II defect counts.
- n2
Phase II inspection size or vector of sizes.
- lambda
Known or estimated in-control defect rate.
- u2
Phase II rates, used instead of
x2.- alpha
Nominal two-sided false-alarm probability.
Details
For Phase I, supply n1 and exactly one of x1 or u1.
For Phase II, supply n2 and exactly one of x2 or u2,
together with Phase I information or a known lambda.
When inspection sizes vary, the in-control rate is estimated by the pooled Poisson estimator \(sum(x_i)/sum(n_i)\).
Examples
data(moonroof)
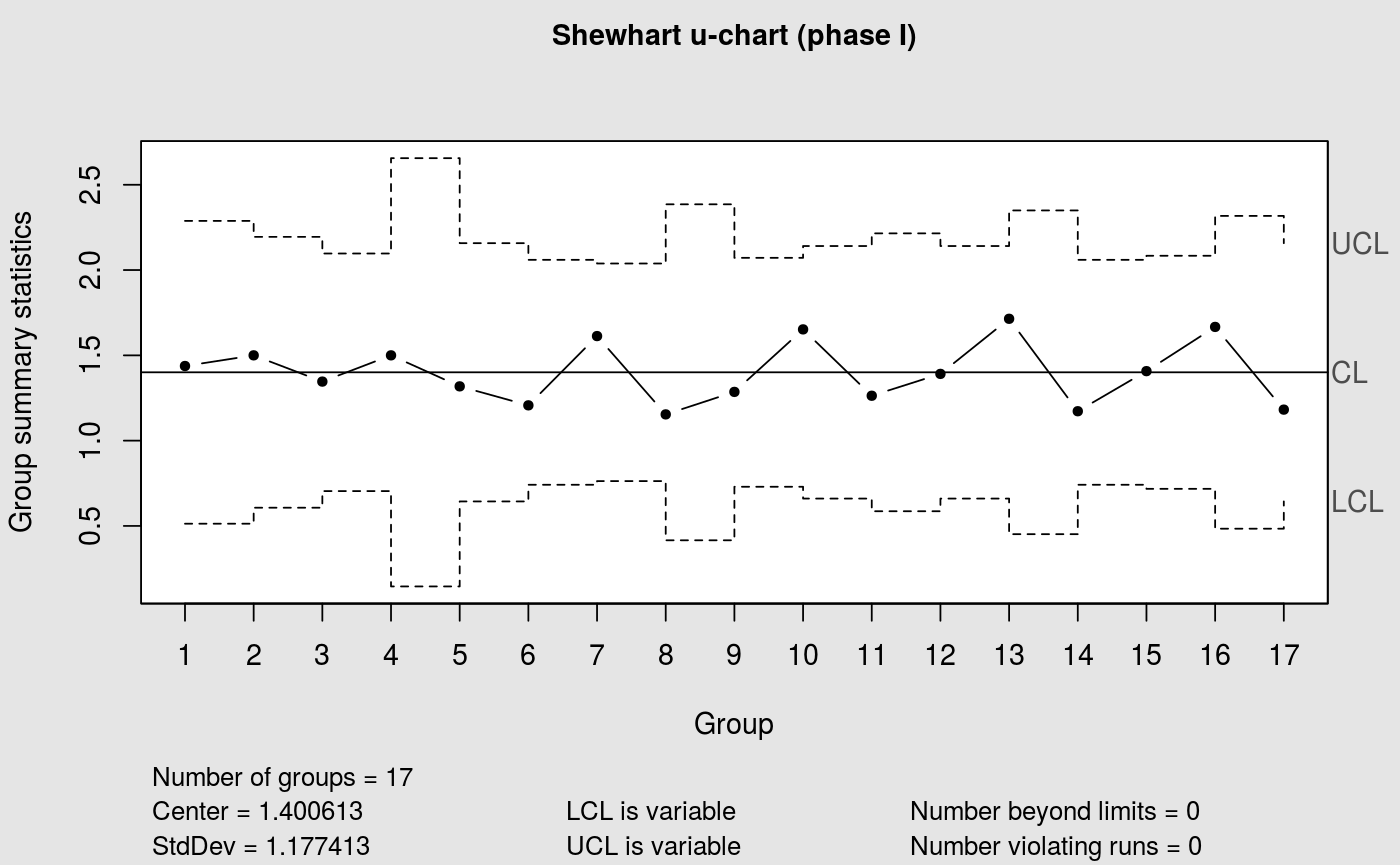
cchart.u(x1 = moonroof$yi[1:17], n1 = moonroof$ni[1:17])
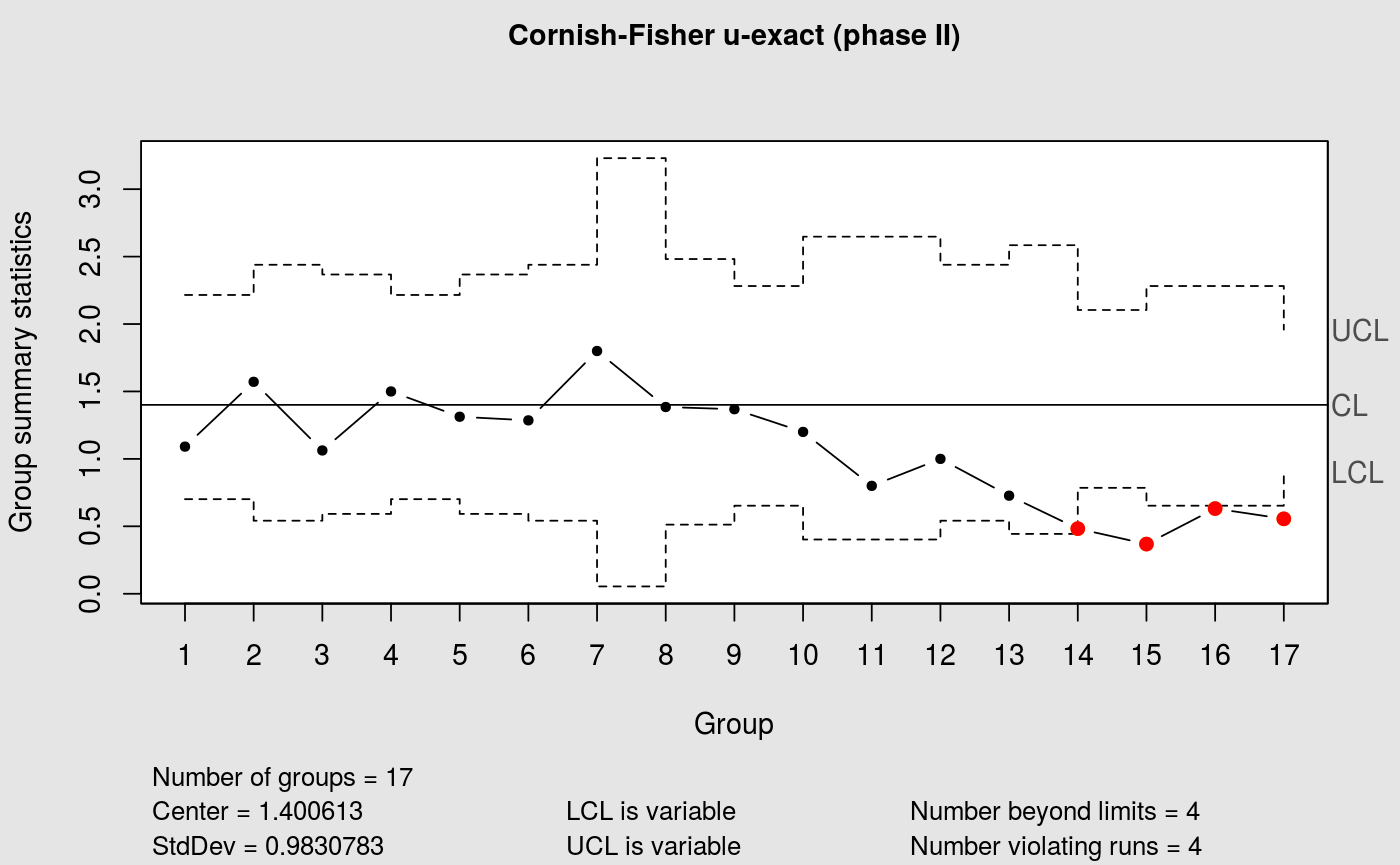
 cchart.u(x1 = moonroof$yi[1:17], n1 = moonroof$ni[1:17],
type = "CF", x2 = moonroof$yi[18:34], n2 = moonroof$ni[18:34])
cchart.u(x1 = moonroof$yi[1:17], n1 = moonroof$ni[1:17],
type = "CF", x2 = moonroof$yi[18:34], n2 = moonroof$ni[18:34])
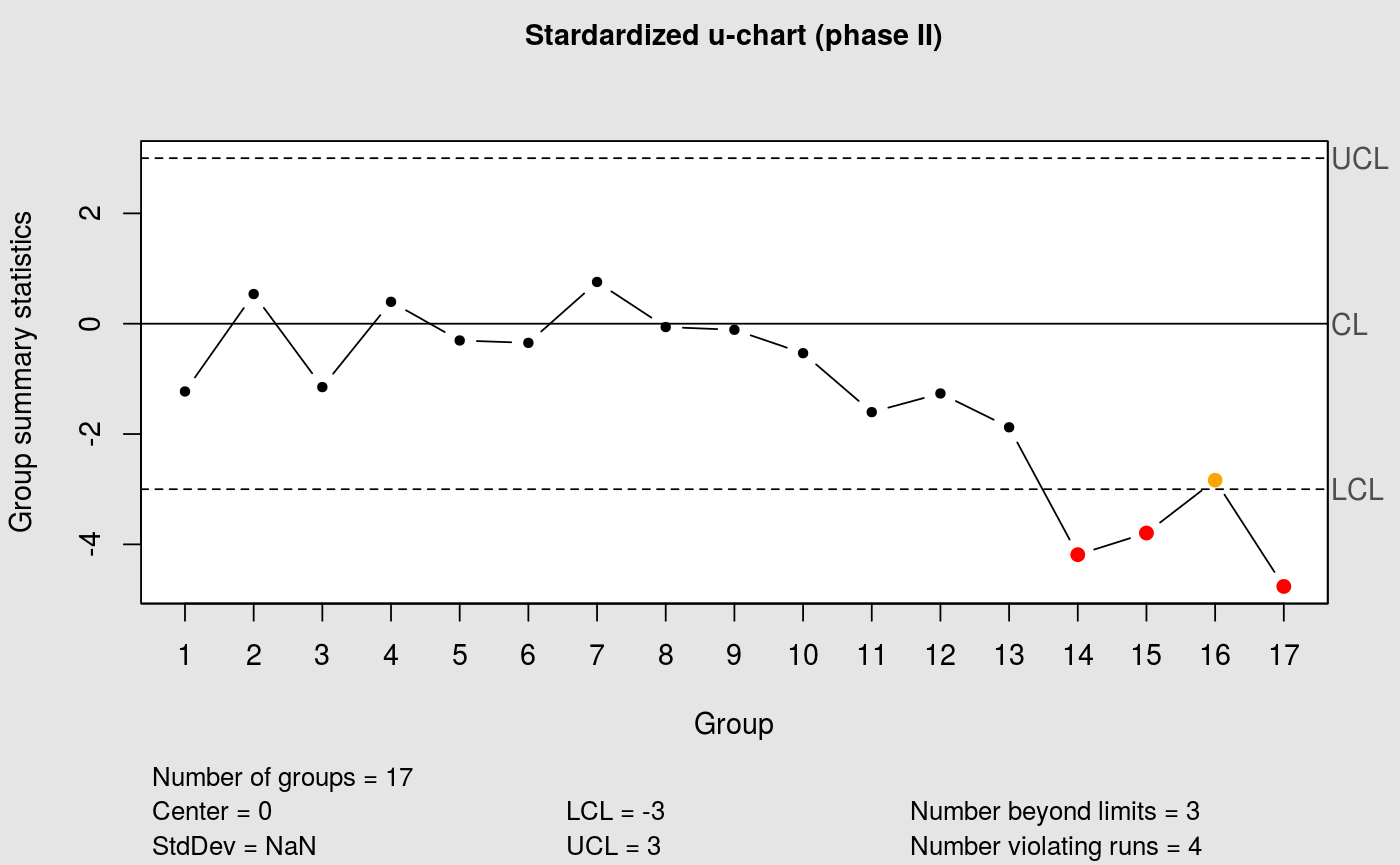
 cchart.u(type = "std", u2 = moonroof$ui[18:34],
n2 = moonroof$ni[18:34], lambda = 1.4)
cchart.u(type = "std", u2 = moonroof$ui[18:34],
n2 = moonroof$ni[18:34], lambda = 1.4)