Add a new Phase II point to an existing Hotelling T² chart. Computes the T²
statistic via T2.2 and plots it. Use after
cchart.T2.2 to build the chart incrementally.
Arguments
- datum2
New Phase II data (vector for \(n = 1\), matrix for \(n > 1\)).
- estat
Phase I statistics (list from
stats).- T2II
Previous T² vector (updated in calling code).
- n
Subgroup size. Use \(n = 1\) for individual observations, \(n > 1\) for subgroups.
- j
Index of this new sample.
- m
Optional. Number of Phase I samples (needed if Phase I data is shown).
Details
To use this function it is necessary to have the output given by the
function T2.2. At every step you should enter the new data set.
Examples
mu <- c(5.682, 88.22)
Sigma <- miscTools::symMatrix(c(3.770, -5.495, 13.53), 2)
datum <- data.1(20, 10, mu, Sigma)
estat <- stats(datum, 20, 10, 2)
datum2 <- data.2(estat, 10, p = 2)
T2II <- T2.2(datum2, estat, 10)
#Not showing the phase I data set.
cchart.T2.2(T2II, 20, 10, 1, 25, 2)
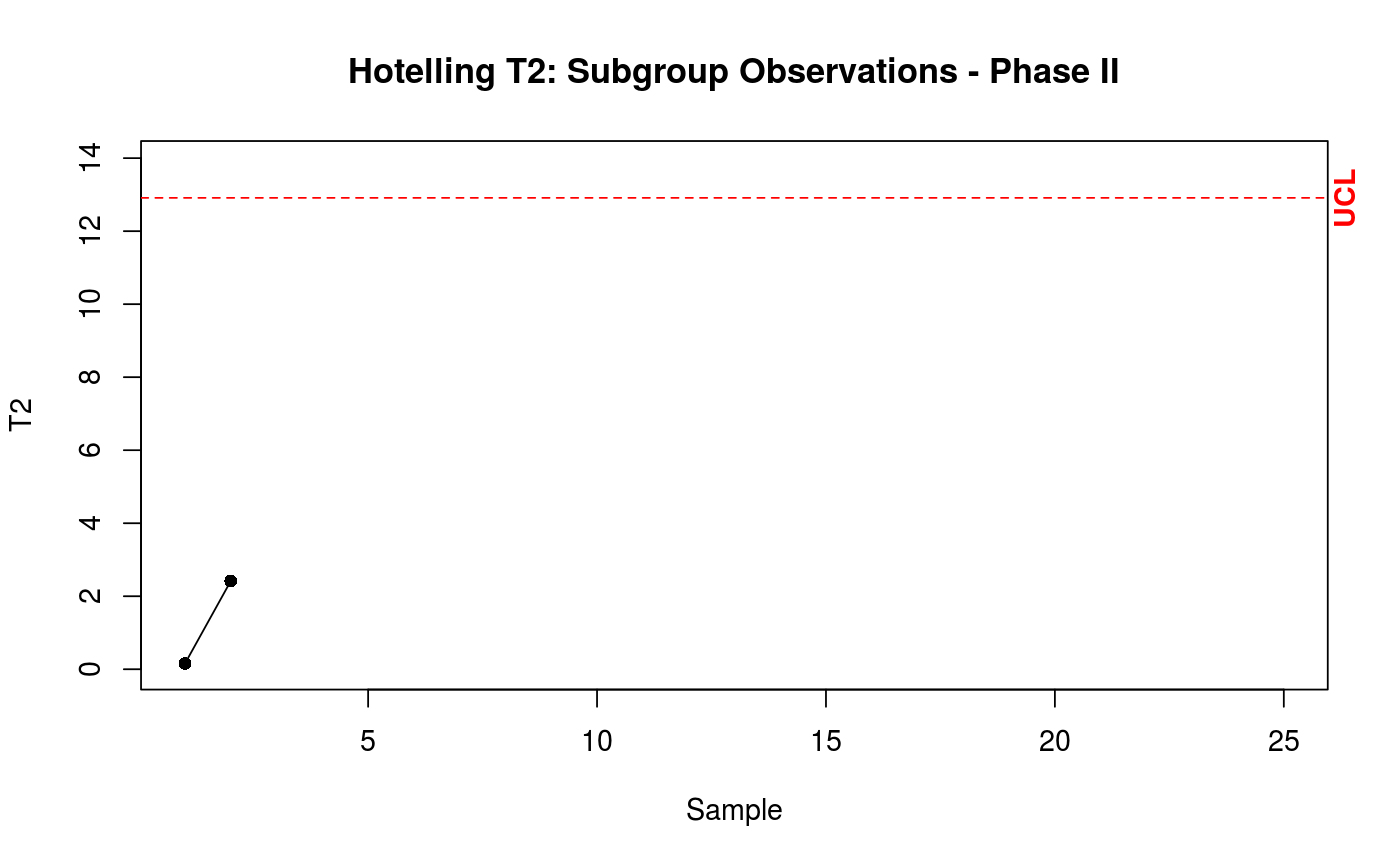
datum3 <- data.2(estat, 10, p = 2)
add.data(datum3, estat, T2II, 10, 2)
 #Showing the phase I data set.
cchart.T2.2(T2II, 20, 10, 1, 25, 2, datum = datum)
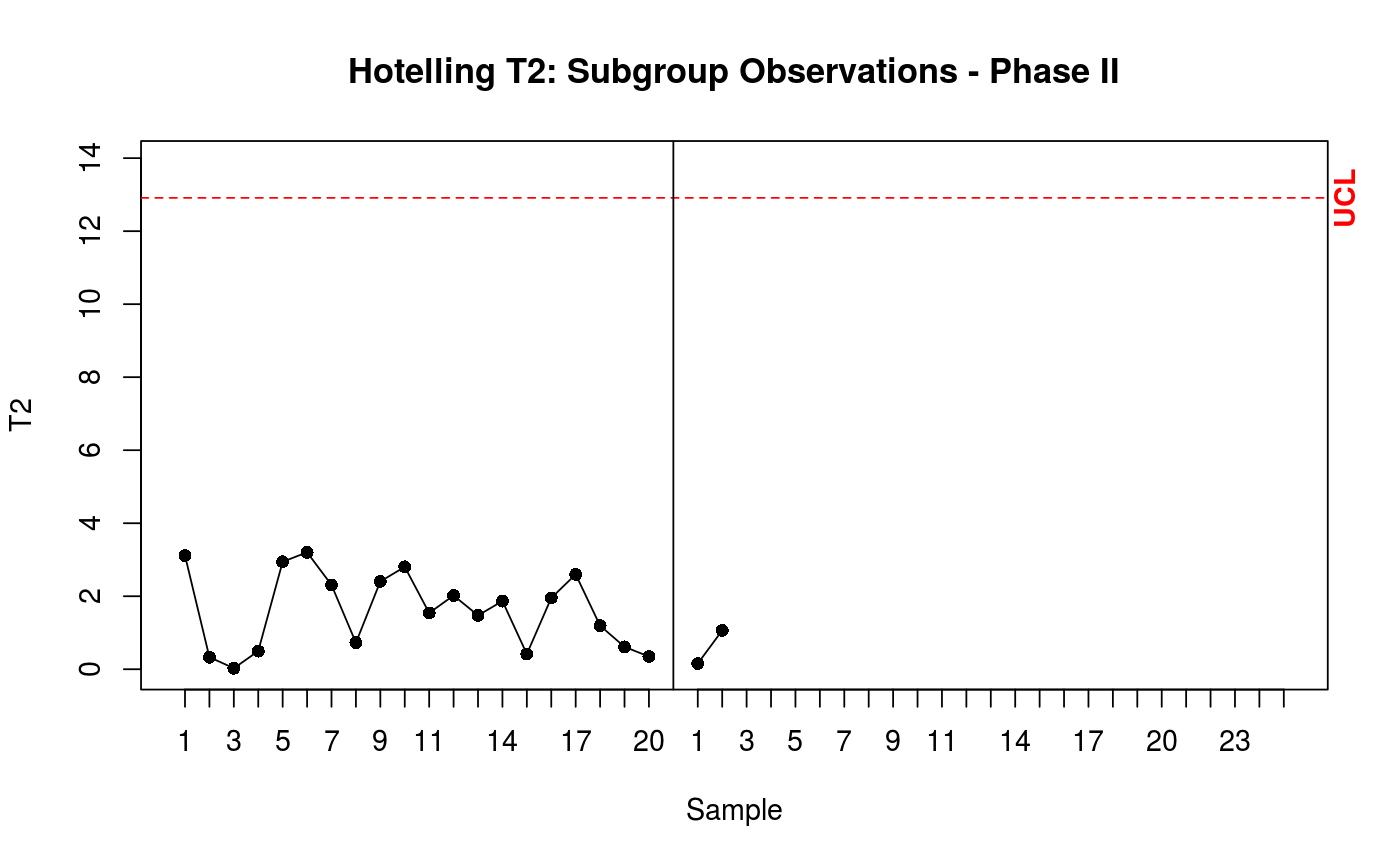
datum3 <- data.2(estat, 10, p = 2)
add.data(datum3, estat, T2II, 10, 2, 20)
#Showing the phase I data set.
cchart.T2.2(T2II, 20, 10, 1, 25, 2, datum = datum)
datum3 <- data.2(estat, 10, p = 2)
add.data(datum3, estat, T2II, 10, 2, 20)
 #Example with individual observations
datum <- data.1(50, 1, mu, Sigma)
estat <- stats(datum, 50, 1, 2)
datum2 <- data.2(estat, 1, p = 2)
T2II <- T2.2(datum2, estat, 1)
#Not showing the phase I data set.
cchart.T2.2(T2II, 50, 1, 1, 25, 2)
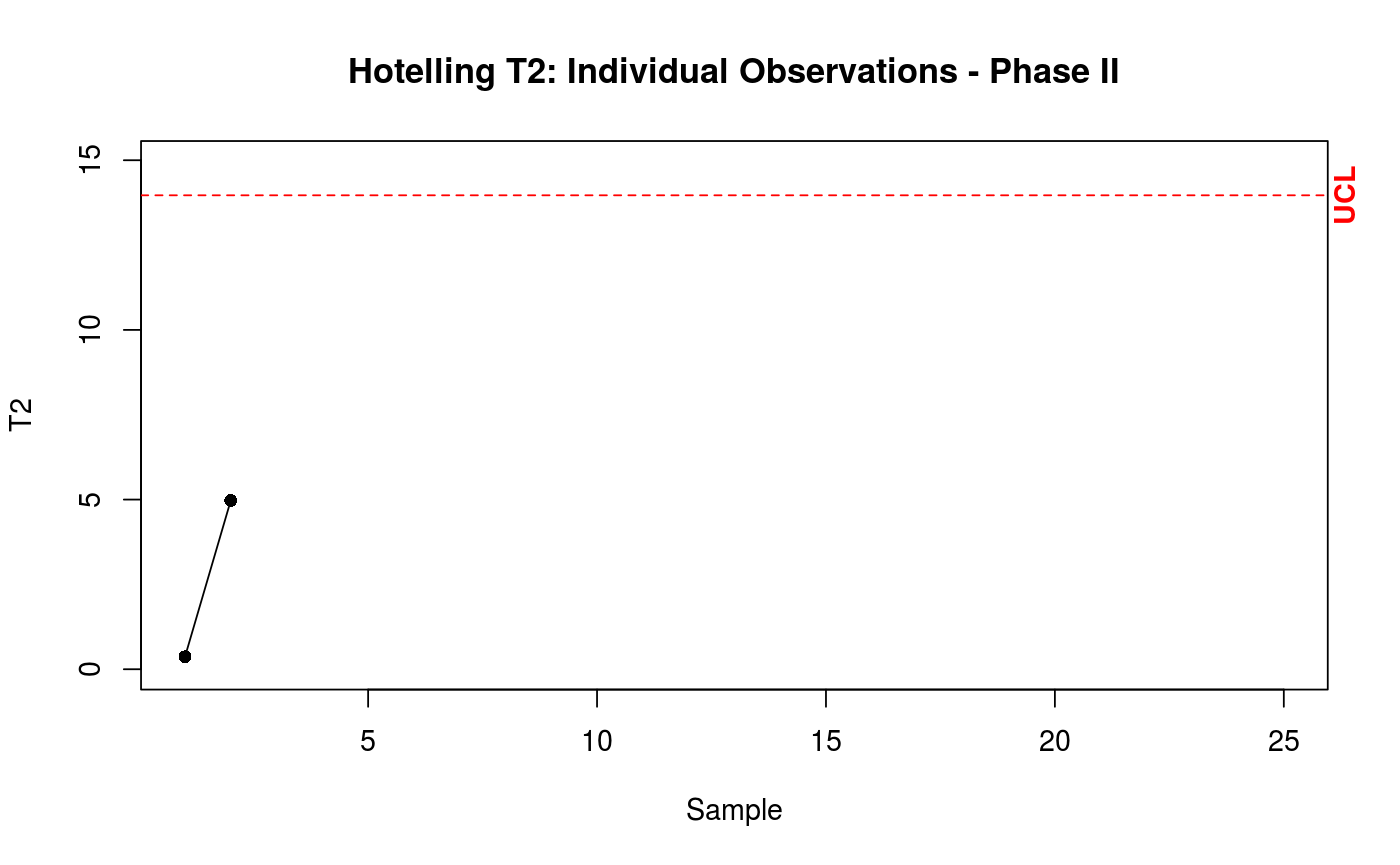
datum3 <- data.2(estat, 1, p = 2)
add.data(datum3, estat, T2II, 1, 2)
#Example with individual observations
datum <- data.1(50, 1, mu, Sigma)
estat <- stats(datum, 50, 1, 2)
datum2 <- data.2(estat, 1, p = 2)
T2II <- T2.2(datum2, estat, 1)
#Not showing the phase I data set.
cchart.T2.2(T2II, 50, 1, 1, 25, 2)
datum3 <- data.2(estat, 1, p = 2)
add.data(datum3, estat, T2II, 1, 2)
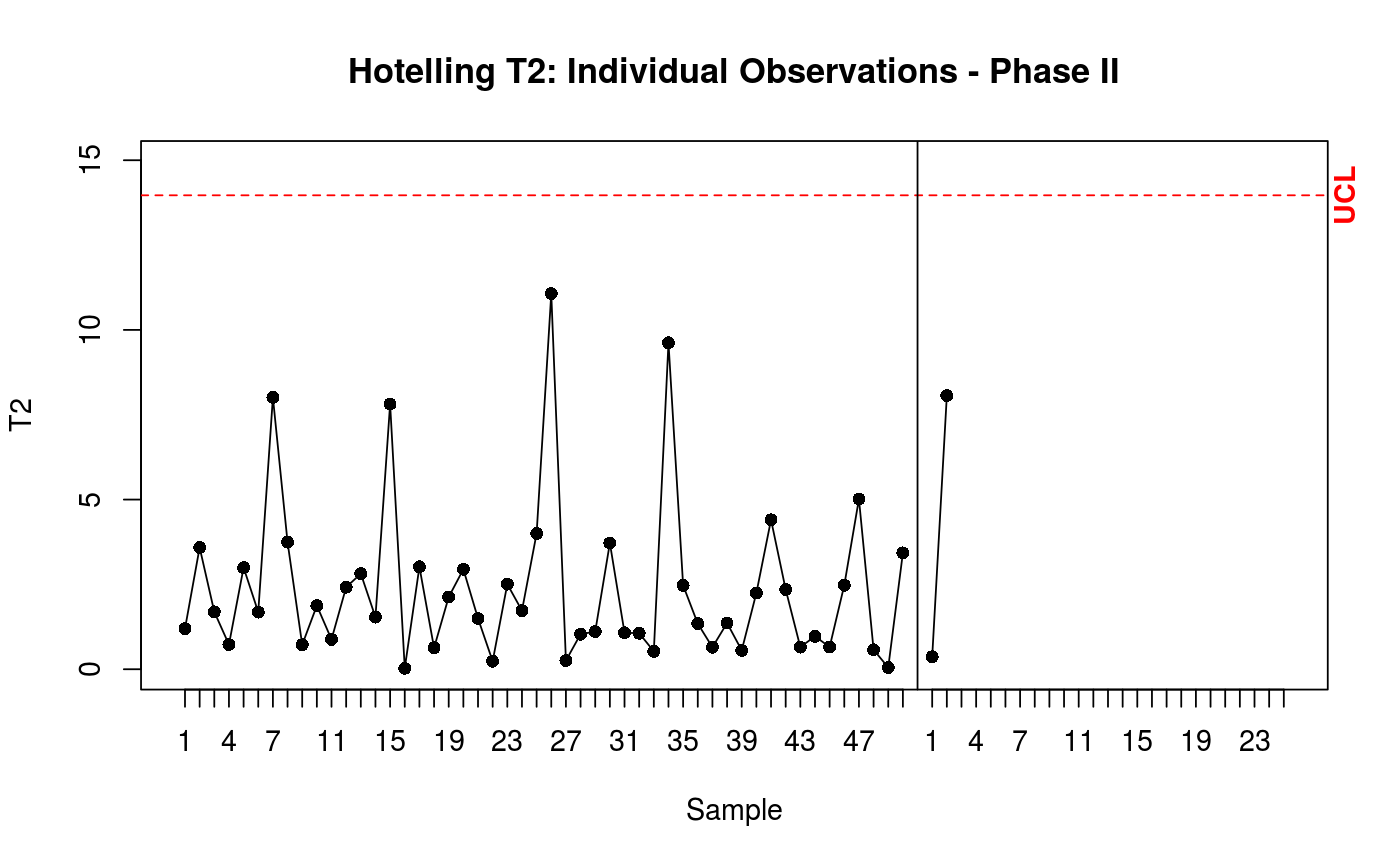
 #Showing the phase I data set.
cchart.T2.2(T2II, 50, 1, 1, 25, 2, datum = datum)
datum3 <- data.2(estat, 1, p = 2)
add.data(datum3, estat, T2II, 1, 2, 50)
#Showing the phase I data set.
cchart.T2.2(T2II, 50, 1, 1, 25, 2, datum = datum)
datum3 <- data.2(estat, 1, p = 2)
add.data(datum3, estat, T2II, 1, 2, 50)