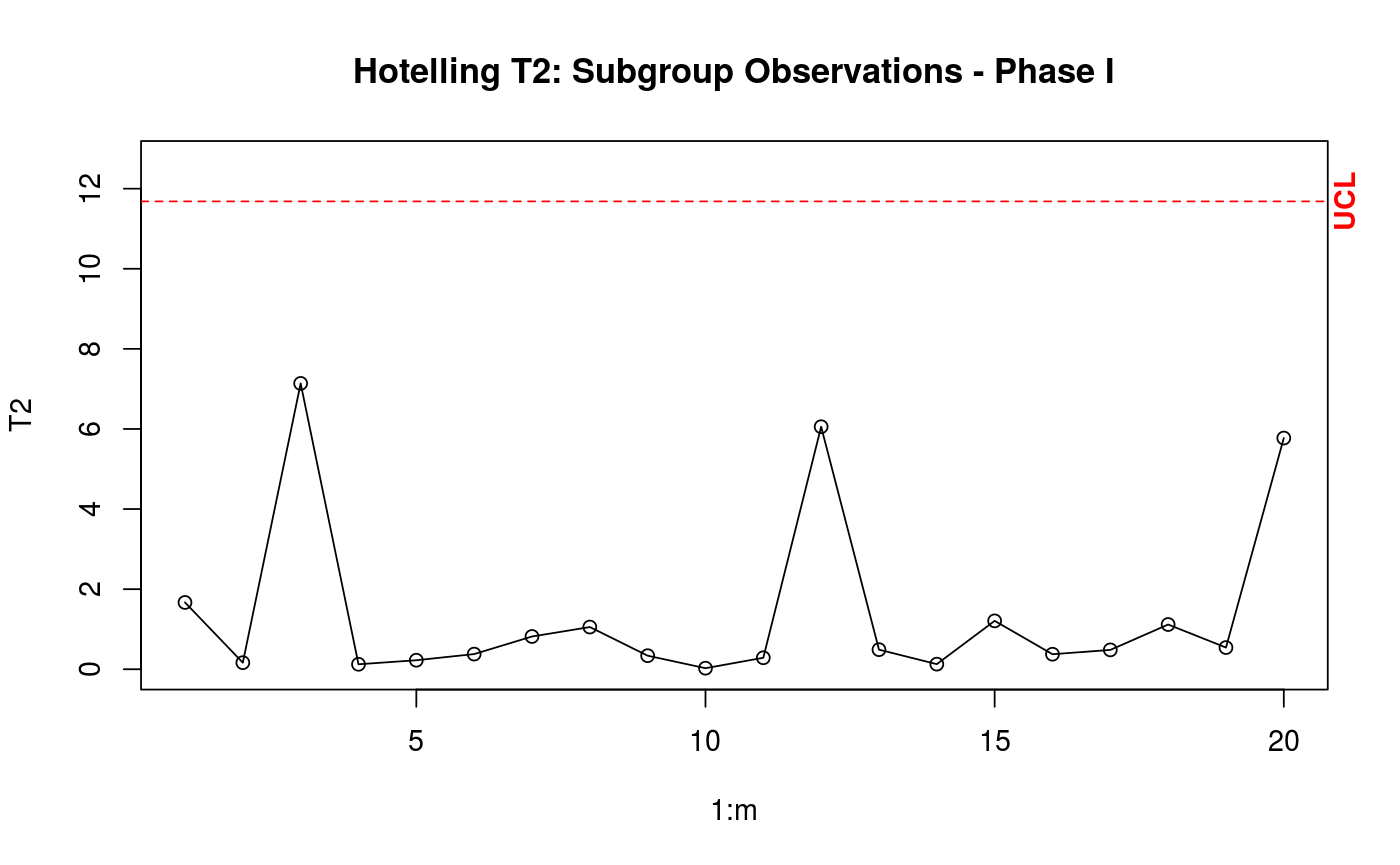
Build a Phase I T² control chart. For \(n = 1\): \(UCL = ((m-1)^2/m) \times qbeta(1-\alpha, p/2, (m-p-1)/2)\). For \(n > 1\): \(UCL = (p(m-1)(n-1))/(mn-m-p+1) \times qf(1-\alpha, p, mn-m-p+1)\). The control limits are based on the beta and F distributions.
Arguments
- T2
Numeric vector of T² statistics from
T2.1.- m
Number of subgroups in Phase I.
- n
Subgroup size. Use \(n = 1\) for individual observations, \(n > 1\) for subgroups.
- p
Number of variables (dimension).
References
Montgomery, D.C., (2009). "Introduction to Statistical Quality Control". Chapter 11. Wiley.
Examples
mu <- c(5.682, 88.22)
Sigma <- miscTools::symMatrix(c(3.770, -5.495, 13.53), 2)
datum <- data.1(20, 10, mu, Sigma)
estat <- stats(datum, 20, 10, 2)
T2 <- T2.1(estat, 20, 10)
# estat is a list with the auxiliary statistics. T2 is a matrix with the values of the T2 statistic.
cchart.T2.1(T2, 20, 10, 2)