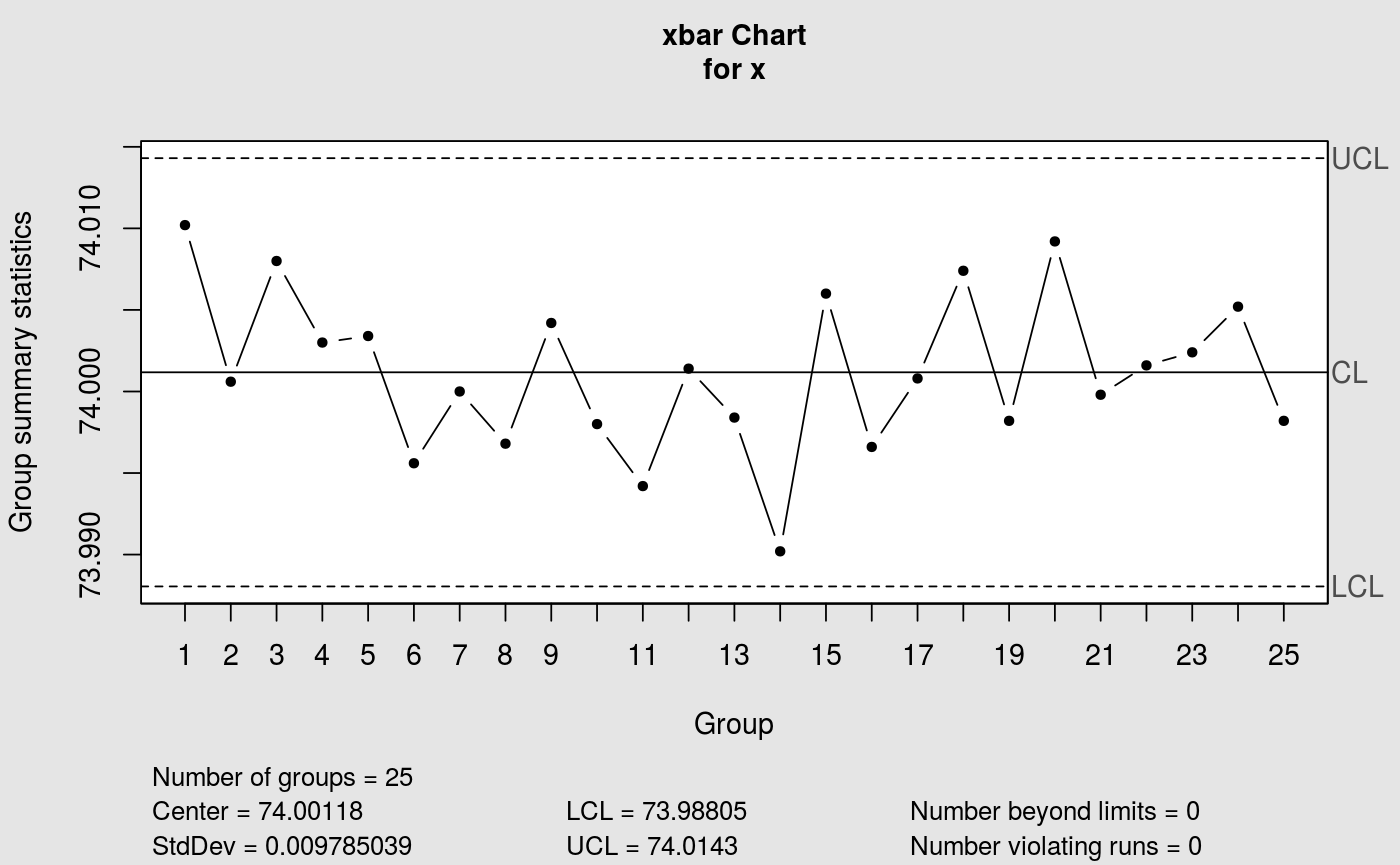
Builds the X-bar control chart for Phase I retrospective analysis. The control limits are estimated from the supplied data. Even if the data is not normal, the X-bar statistic is approximately normal by the central limit theorem when subgroup sizes are sufficiently large.
Value
A list with components x2bar (mean of subgroup means) and sigma (standard deviation), returned invisibly. The control chart is drawn as a side effect.
References
Montgomery, D.C., (2009). "Introduction to Statistical Quality Control". Chapter 6. Wiley.
Examples
data(pistonrings)
cchart.Xbar1(pistonrings[1:25, ], 5)