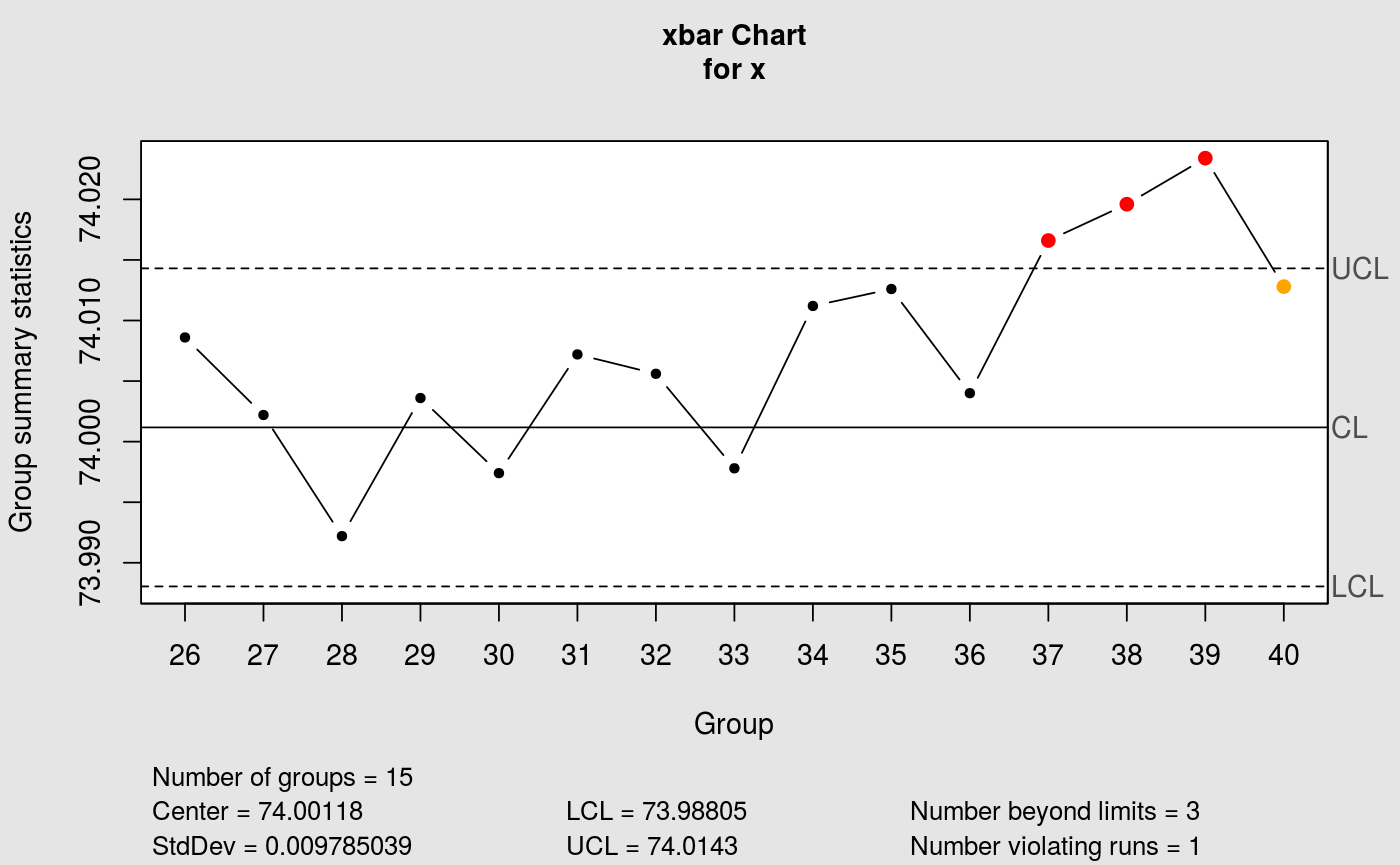
Builds the X-bar control chart for Phase II monitoring using reference
limits obtained from a Phase I analysis. The Phase I estimates of
x2bar (mean of means) and sigma (standard deviation) are
required, typically obtained from cchart.Xbar1.
References
Montgomery, D.C., (2009). "Introduction to Statistical Quality Control". Chapter 6. Wiley.
Examples
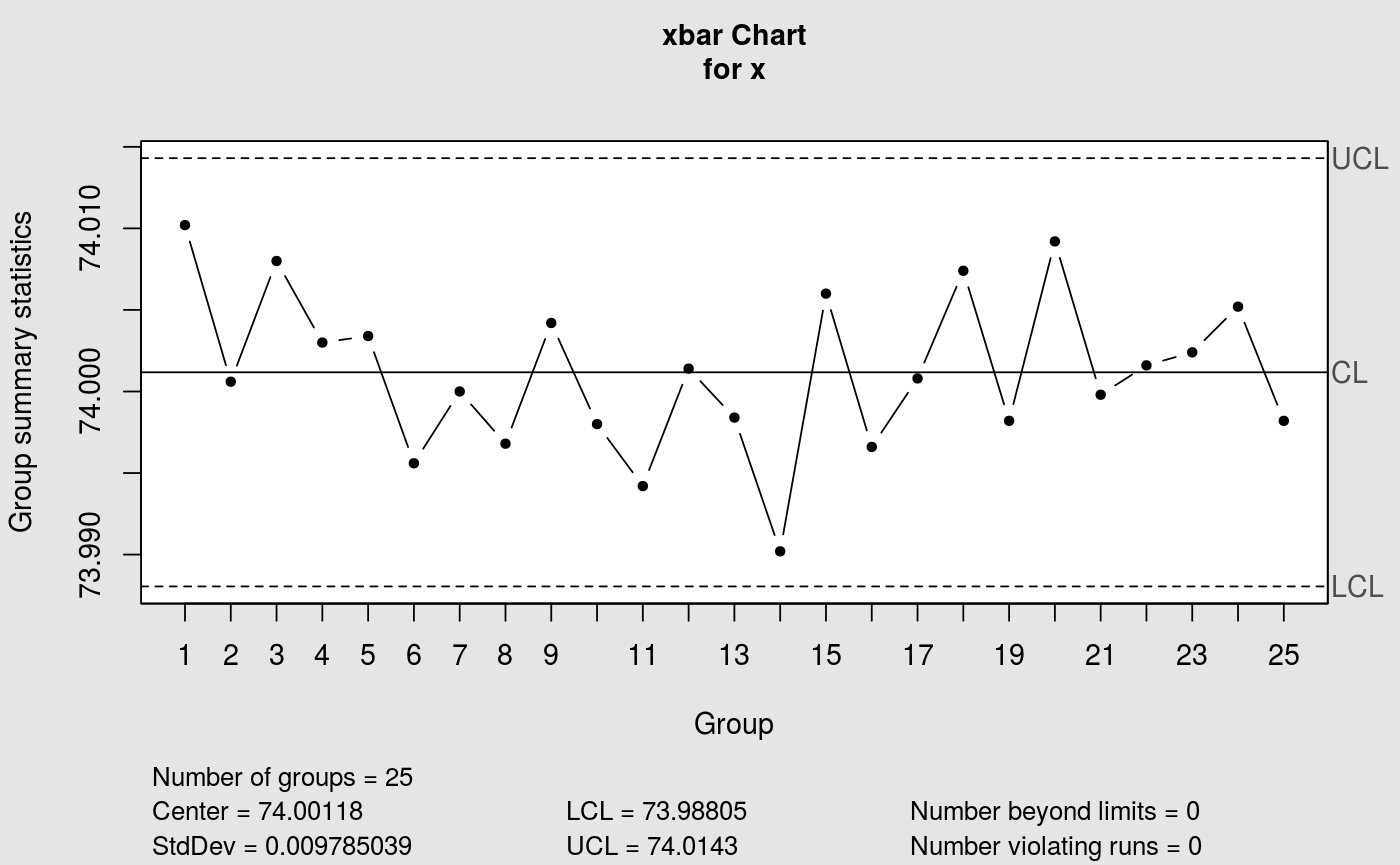
data(pistonrings)
stat <- cchart.Xbar1(pistonrings[1:25, ], 5)

cchart.Xbar2(pistonrings[26:40, ], stat[[1]][1], stat[[1]][2], 5)

#> List of 11
#>  $ call      : language qcc(data = x, type = "xbar", center = x2bar, std.dev = sigma)
#>  $ type      : chr "xbar"
#>  $ data.name : chr "x"
#>  $ data      : num [1:15, 1:5] 74 74 74 74 74 ...
#>   ..- attr(*, "dimnames")=List of 2
#>  $ statistics: Named num [1:15] 74 74 74 74 74 ...
#>   ..- attr(*, "names")= chr [1:15] "26" "27" "28" "29" ...
#>  $ sizes     : Named int [1:15] 5 5 5 5 5 5 5 5 5 5 ...
#>   ..- attr(*, "names")= chr [1:15] "26" "27" "28" "29" ...
#>  $ center    : num 74
#>  $ std.dev   : num 0.00979
#>  $ nsigmas   : num 3
#>  $ limits    : num [1, 1:2] 74 74
#>   ..- attr(*, "dimnames")=List of 2
#>  $ violations:List of 2
#>  - attr(*, "class")= chr "qcc"
#> List of 11
#> $ call : language qcc(data = x, type = "xbar", center = x2bar, std.dev = sigma)
#> $ type : chr "xbar"
#> $ data.name : chr "x"
#> $ data : num [1:15, 1:5] 74 74 74 74 74 ...
#> ..- attr(*, "dimnames")=List of 2
#> $ statistics: Named num [1:15] 74 74 74 74 74 ...
#> ..- attr(*, "names")= chr [1:15] "26" "27" "28" "29" ...
#> $ sizes : Named int [1:15] 5 5 5 5 5 5 5 5 5 5 ...
#> ..- attr(*, "names")= chr [1:15] "26" "27" "28" "29" ...
#> $ center : num 74
#> $ std.dev : num 0.00979
#> $ nsigmas : num 3
#> $ limits : num [1, 1:2] 74 74
#> ..- attr(*, "dimnames")=List of 2
#> $ violations:List of 2
#> - attr(*, "class")= chr "qcc"