Builds and displays an X-bar control chart for Phase I (retrospective
analysis), Phase II (monitoring of future production), or both phases
in a single call. When Phase I data is supplied without Phase II data,
the chart uses estimated control limits. If Phase II data is supplied
without Phase I data, the chart requires x2bars and sigma
as reference values.
Arguments
- x1
Phase I data. A matrix or data frame where each row is a subgroup.
- n1
Phase I subgroup size(s). A single integer (equal sizes) or a vector.
- x2
Phase II data. Same structure as x1.
- n2
Phase II subgroup size(s).
- x2bars
Mean of subgroup means from Phase I (center line). Can be NULL and computed from x1.
- sigma
Standard deviation from Phase I (for control limits). Can be NULL and computed from x1.
Value
Draws the X-bar control chart using qcc. For Phase I only, invisibly returns a list with components x2bar (mean of means) and sigma (standard deviation).
Phase convention
Phase I when only Phase I data is supplied; limits are estimated from the data. Phase II when Phase II data is supplied (with or without Phase I reference data).
References
Montgomery, D.C., (2009). "Introduction to Statistical Quality Control". Chapter 6. Wiley.
Examples
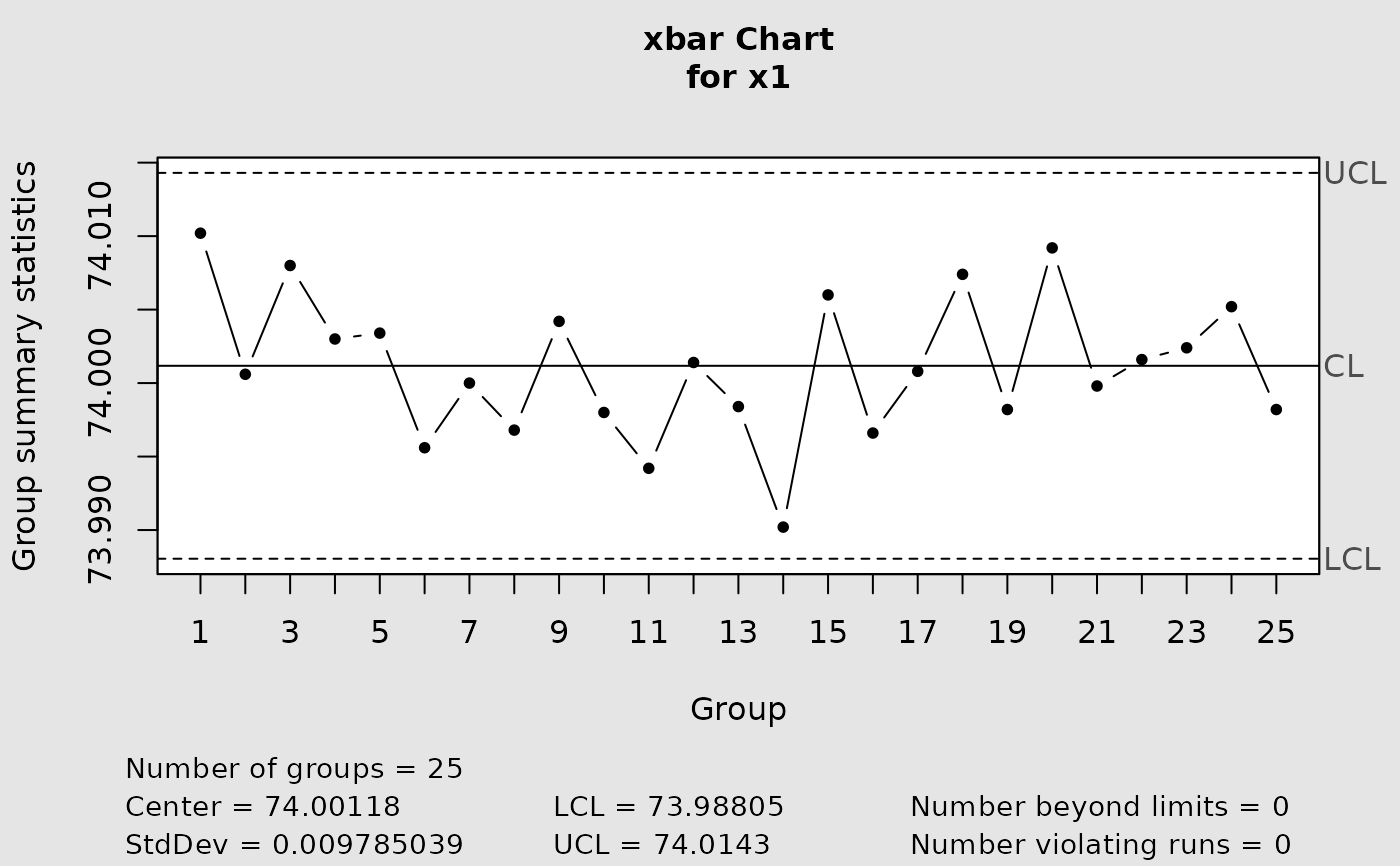
data(pistonrings)
cchart.Xbar(x1 = pistonrings[1:25, ], n1 = 5)
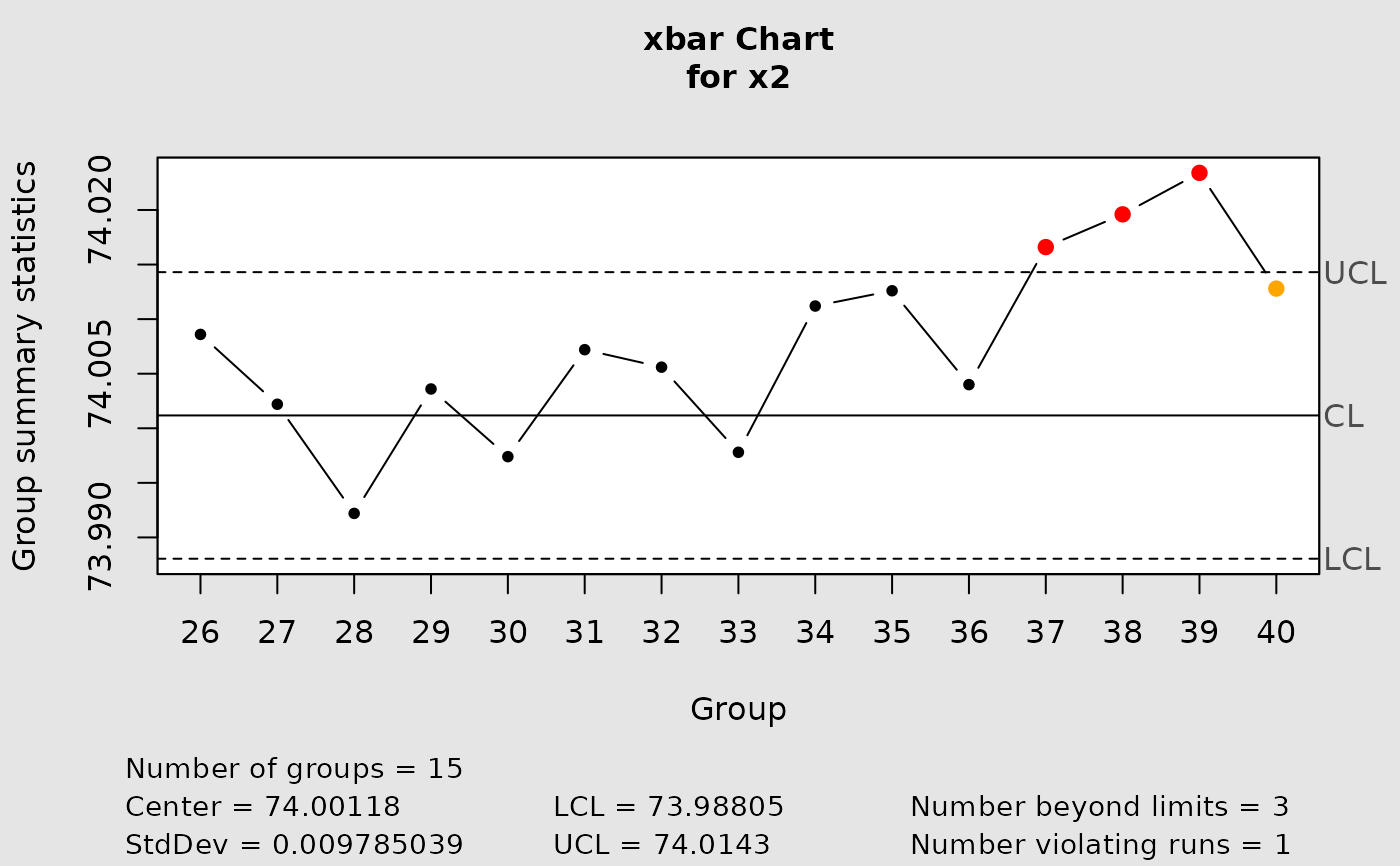
 cchart.Xbar(x1 = pistonrings[1:25, ], n1 = 5, x2 = pistonrings[26:40, ], n2 = 5)
 #> List of 11
#> $ call : language qcc(data = x2, type = "xbar", center = x2bars, std.dev = sigma)
#> $ type : chr "xbar"
#> $ data.name : chr "x2"
#> $ data : num [1:15, 1:5] 74 74 74 74 74 ...
#> ..- attr(*, "dimnames")=List of 2
#> $ statistics: Named num [1:15] 74 74 74 74 74 ...
#> ..- attr(*, "names")= chr [1:15] "26" "27" "28" "29" ...
#> $ sizes : Named int [1:15] 5 5 5 5 5 5 5 5 5 5 ...
#> ..- attr(*, "names")= chr [1:15] "26" "27" "28" "29" ...
#> $ center : num 74
#> $ std.dev : num 0.00979
#> $ nsigmas : num 3
#> $ limits : num [1, 1:2] 74 74
#> ..- attr(*, "dimnames")=List of 2
#> $ violations:List of 2
#> - attr(*, "class")= chr "qcc"
#> List of 11
#> $ call : language qcc(data = x2, type = "xbar", center = x2bars, std.dev = sigma)
#> $ type : chr "xbar"
#> $ data.name : chr "x2"
#> $ data : num [1:15, 1:5] 74 74 74 74 74 ...
#> ..- attr(*, "dimnames")=List of 2
#> $ statistics: Named num [1:15] 74 74 74 74 74 ...
#> ..- attr(*, "names")= chr [1:15] "26" "27" "28" "29" ...
#> $ sizes : Named int [1:15] 5 5 5 5 5 5 5 5 5 5 ...
#> ..- attr(*, "names")= chr [1:15] "26" "27" "28" "29" ...
#> $ center : num 74
#> $ std.dev : num 0.00979
#> $ nsigmas : num 3
#> $ limits : num [1, 1:2] 74 74
#> ..- attr(*, "dimnames")=List of 2
#> $ violations:List of 2
#> - attr(*, "class")= chr "qcc"